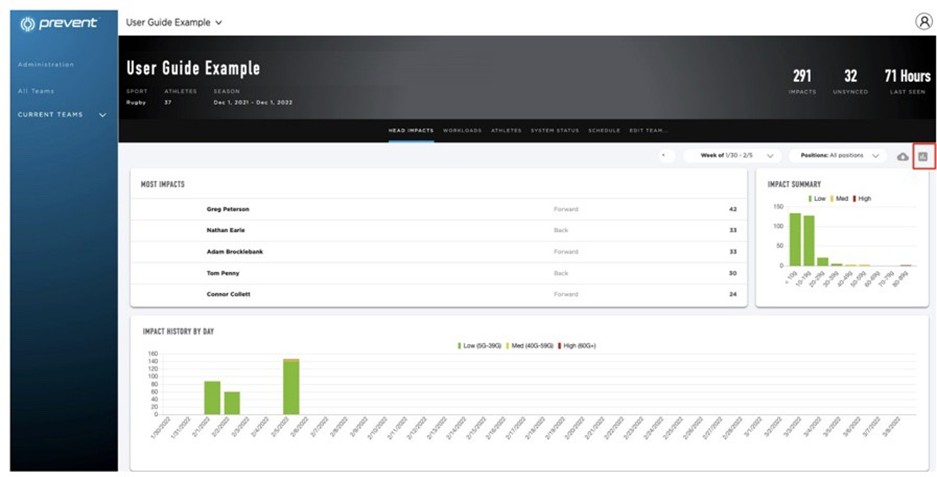
The second type of report you can run, is an “Impact Summary” report. In order to run this report, you must also be underneath the “Head Impacts” tab within your team page. Once you are there, you will want to select the bar graph icon in the upper right as signified with the red box below.

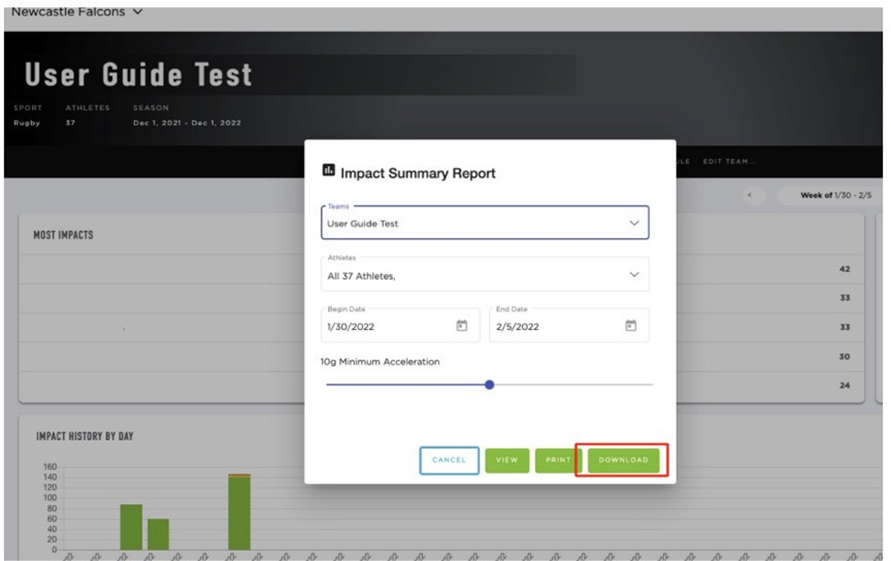
After selecting the bar graph icon, a pop-up window will appear. In the pop-up window, you will fill out the relevant information that you’re looking for on the report. As you saw in the earlier slide, altering any of the criteria will give you a different outcome to match the specific information you are looking for. Once you’ve set your criteria for the report, you will select “Download” to view.

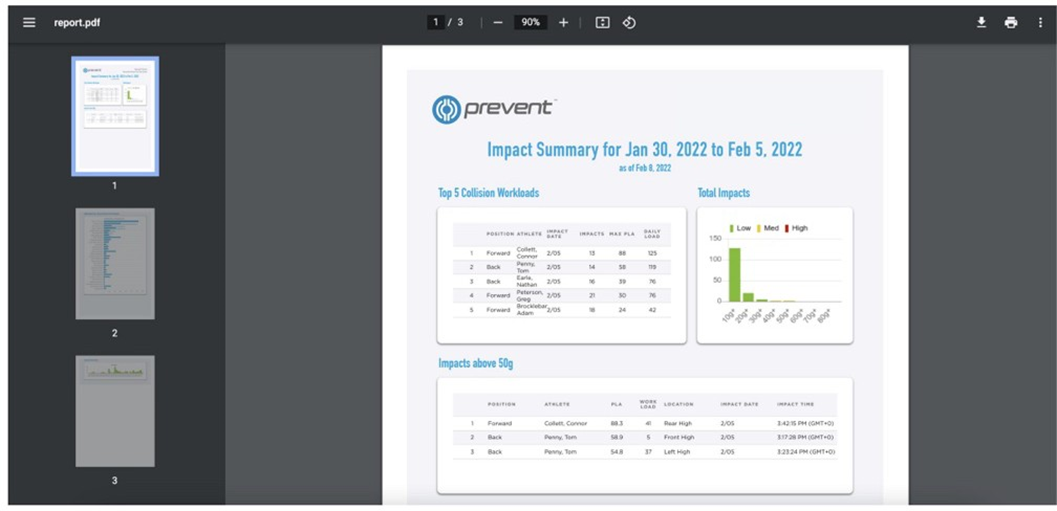
Once you’ve selected “Download” a 3-page report should generate. This report will present an Impact Summary for the date range that you’ve selected.
The first page will show you a table with the “Top 5 Collision Workloads”, a graph showing “Total Impacts” and notify you of any Impacts above 50g.The second page has a graph that contains athlete specific impact loads. This graph will have the day’s impact load as well as the historical average workload. The third page displays a graph that shows the impacts by time period.

