During the syncing process, data is uploaded to the online Portal in real-time from the Prevent App. This is available to view immediately for any user, at any location.
The online Portal provides detailed dashboards to view and analyse your team’s iMG data. This includes easily accessible insights on the impacts and workloads across your team, and for individual athletes.
This article will guide you through how to navigate and view data within the Prevent Portal. The following sections will cover viewing data on the Impacts and Workloads tabs on the Portal (see image below).

Impacts
This dashboard offers an overview of impacts (Head Acceleration Events) for all athletes on your team.
You can easily filter the displayed data by using the dropdown menu to select the date ranges required. Additionally, the Minimum PLA slider on the left can be utilised to only display impacts exceeding the chosen value.
Total Impacts - Shows the total number of impacts for each athlete within the team.
Alerts - This highlights high-magnitude head impacts that exceed a specified threshold. To configure a custom alert value tailored to your team's needs, please reach out to Prevent Support for assistance.
Impact Summary - Shows the distribution of low, medium, and high magnitude impacts across the team - i.e. 10-19g, 20-29g etc.
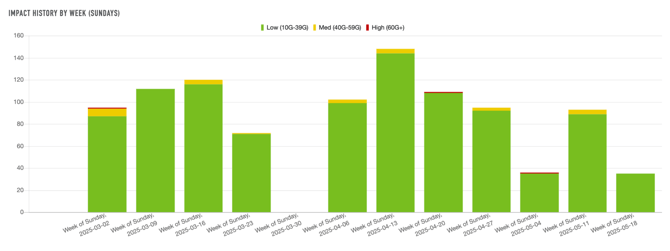
Impact History By Week/Day - A stacked bar chart that displays the number of impacts categorised as low, medium, and high for each day or week within the chosen date range. By clicking on any bar, you can access a more detailed view of the data for that specific period.
How to view detailed metrics on each head impact?
To view detailed metrics for each head impact, navigate to the 'Impact History By Day' bar graph. Click on the bar that corresponds to your desired time period . A pop-up window will appear, displaying the metrics for all impact events recorded and synced on that specific day.
Here you can access a range of detailed metrics for each impact event associated with every athlete. This information includes the precise time of the impact, as well as the peak values for linear and angular acceleration and velocity, and the location where the impact occurred.
Use the search bar and Minimum PLA slider to quickly filter impact events for a specific athlete or magnitude. 
Workloads
The Workloads dashboard presents each athlete’s total Workload (J) over the selected date range. Adjust the date range using the dropdown menu to focus on specific periods as needed.
Below are the definitions for the Work and Workload metrics available using the Prevent iMG:
Work (J): The summation of the head's estimated linear and rotational kinetic energy change due to a Head Acceleration Event. Quantified in Joules.
Workload (J): The summation of Work for each Head Acceleration Event.
The dashboard also allows you to compare each athlete’s Daily Average Workload to their Historical Average Workload, visualised in a horizontal bar chart (see below).
This enables you to quickly identify athletes with above-average Workload, supporting proactive monitoring of training exposure and aiding in decisions around additional medical screening.

For further details on the Work and Workload metrics available with the Prevent IMG, please see our comprehensive Data Guide article. This is specifically designed to enhance your understanding and usage of the technology. Click here to view.